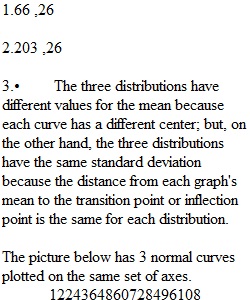
Q Question 1. Version 1*/1. Score: 1/2 The graph illustrates the "Distribution of College Algebra Course Grades". 304254667890102Distribution of College Algebra Course Grades[Graphs generated by this script: setBorder(10,30,10,5);initPicture(-3.5,3.5,-.1,.45);line([-15.5,0],[15.5,0]);line([-3,.02],[-3,-.02]);text([-3,-.01],"30","below");line([-2,.02],[-2,-.02]);text([-2,-.01],"42","below");line([-1,.02],[-1,-.02]);text([-1,-.01],"54","below");line([0,.02],[0,-.02]);text([0,-.01],"66","below");line([1,.02],[1,-.02]);text([1,-.01],"78","below");line([2,.02],[2,-.02]);text([2,-.01],"90","below");line([3,.02],[3,-.02]);text([3,-.01],"102","below");textabs([200,0],'Distribution of College Algebra Course Grades','above');fill="none";path([[-3.5,0.00087268270248894],[-3.4125,0.0011808548546798],[-3.325,0.0015856655971737],[-3.2375,0.0021130103340165],[-3.15,0.0027942584387119],[-3.0625,0.00366696237757],[-2.975,0.0047755266178224],[-2.8875,0.006171788271972],[-2.8,0.0079154516504915],[-2.7125,0.01007431010247],[-2.625,0.012724181705357],[-2.5375,0.015948481633483],[-2.45,0.01983735456099],[-2.3625,0.024486296371885],[-2.275,0.029994206738768],[-2.1875,0.036460833487169],[-2.1,0.043983596355567],[-2.0125,0.052653811509711],[-1.925,0.062552378033174],[-1.8375,0.073745031931229],[-1.75,0.086277319562377],[-1.6625,0.10016948780033],[-1.575,0.1154115290627],[-1.4875,0.13195865176446],[-1.4,0.14972746691278],[-1.3125,0.16859318595606],[-1.225,0.1883881108589],[-1.1375,0.20890166300605],[-1.05,0.22988214264492],[-0.9625,0.25104033647462],[-0.875,0.27205500069892],[-0.7875,0.2925801450485],[-0.7,0.31225393603],[-0.6125,0.33070893210235],[-0.525,0.34758326725691],[-0.4375,0.36253232013251],[-0.35,0.37524035011739],[-0.2625,0.3854315552717],[-0.175,0.39288001279828],[-0.087500000000002,0.39741800230538],[-2.3037127760972E-15,0.39894228380404],[0.087499999999998,0.39741800230538],[0.175,0.39288001279828],[0.2625,0.3854315552717],[0.35,0.37524035011739],[0.4375,0.36253232013251],[0.525,0.34758326725691],[0.6125,0.33070893210235],[0.7,0.31225393603],[0.7875,0.2925801450485],[0.875,0.27205500069892],[0.9625,0.25104033647462],[1.05,0.22988214264492],[1.1375,0.20890166300605],[1.225,0.1883881108589],[1.3125,0.16859318595606],[1.4,0.14972746691278],[1.4875,0.13195865176446],[1.575,0.1154115290627],[1.6625,0.10016948780033],[1.75,0.086277319562378],[1.8375,0.073745031931229],[1.925,0.062552378033175],[2.0125,0.052653811509711],[2.1,0.043983596355567],[2.1875,0.03646083348717],[2.275,0.029994206738769],[2.3625,0.024486296371886],[2.45,0.01983735456099],[2.5375,0.015948481633483],[2.625,0.012724181705357],[2.7125,0.01007431010247],[2.8,0.0079154516504916],[2.8875,0.0061717882719721],[2.975,0.0047755266178225],[3.0625,0.0036669623775701],[3.15,0.0027942584387119],[3.2375,0.0021130103340166],[3.325,0.0015856655971737],[3.4125,0.0011808548546798],[3.5,0.00087268270248895]]);] What is the mean of this normal distribution? What is the standard deviation of this normal distribution?Question 2. Version 2*/2. Score: 2/2Expand The graph illustrates the "Distribution of the Prices of College Textbooks". 125151177203229255281Distribution of the Prices of College Textbooks[Graphs generated by this script: setBorder(10,30,10,5);initPicture(-3.5,3.5,-.1,.45);line([-29.5,0],[29.5,0]);line([-3,.02],[-3,-.02]);text([-3,-.01],"125","below");line([-2,.02],[-2,-.02]);text([-2,-.01],"151","below");line([-1,.02],[-1,-.02]);text([-1,-.01],"177","below");line([0,.02],[0,-.02]);text([0,-.01],"203","below");line([1,.02],[1,-.02]);text([1,-.01],"229","below");line([2,.02],[2,-.02]);text([2,-.01],"255","below");line([3,.02],[3,-.02]);text([3,-.01],"281","below");textabs([200,0],'Distribution of the Prices of College Textbooks','above');fill="none";path([[-3.5,0.00087268270248894],[-3.4125,0.0011808548546798],[-3.325,0.0015856655971737],[-3.2375,0.0021130103340165],[-3.15,0.0027942584387119],[-3.0625,0.00366696237757],[-2.975,0.0047755266178224],[-2.8875,0.006171788271972],[-2.8,0.0079154516504915],[-2.7125,0.01007431010247],[-2.625,0.012724181705357],[-2.5375,0.015948481633483],[-2.45,0.01983735456099],[-2.3625,0.024486296371885],[-2.275,0.029994206738768],[-2.1875,0.036460833487169],[-2.1,0.043983596355567],[-2.0125,0.052653811509711],[-1.925,0.062552378033174],[-1.8375,0.073745031931229],[-1.75,0.086277319562377],[-1.6625,0.10016948780033],[-1.575,0.1154115290627],[-1.4875,0.13195865176446],[-1.4,0.14972746691278],[-1.3125,0.16859318595606],[-1.225,0.1883881108589],[-1.1375,0.20890166300605],[-1.05,0.22988214264492],[-0.9625,0.25104033647462],[-0.875,0.27205500069892],[-0.7875,0.2925801450485],[-0.7,0.31225393603],[-0.6125,0.33070893210235],[-0.525,0.34758326725691],[-0.4375,0.36253232013251],[-0.35,0.37524035011739],[-0.2625,0.3854315552717],[-0.175,0.39288001279828],[-0.087500000000002,0.39741800230538],[-2.3037127760972E-15,0.39894228380404],[0.087499999999998,0.39741800230538],[0.175,0.39288001279828],[0.2625,0.3854315552717],[0.35,0.37524035011739],[0.4375,0.36253232013251],[0.525,0.34758326725691],[0.6125,0.33070893210235],[0.7,0.31225393603],[0.7875,0.2925801450485],[0.875,0.27205500069892],[0.9625,0.25104033647462],[1.05,0.22988214264492],[1.1375,0.20890166300605],[1.225,0.1883881108589],[1.3125,0.16859318595606],[1.4,0.14972746691278],[1.4875,0.13195865176446],[1.575,0.1154115290627],[1.6625,0.10016948780033],[1.75,0.086277319562378],[1.8375,0.073745031931229],[1.925,0.062552378033175],[2.0125,0.052653811509711],[2.1,0.043983596355567],[2.1875,0.03646083348717],[2.275,0.029994206738769],[2.3625,0.024486296371886],[2.45,0.01983735456099],[2.5375,0.015948481633483],[2.625,0.012724181705357],[2.7125,0.01007431010247],[2.8,0.0079154516504916],[2.8875,0.0061717882719721],[2.975,0.0047755266178225],[3.0625,0.0036669623775701],[3.15,0.0027942584387119],[3.2375,0.0021130103340166],[3.325,0.0015856655971737],[3.4125,0.0011808548546798],[3.5,0.00087268270248895]]);] What is the mean of this normal distribution? What is the standard deviation of this normal distribution?Question 3. Version 1*/1. Score: 2/2 The picture below has 3 normal curves plotted on the same set of axes. 1224364860728496108 Which of these best explains the relationships between the means and standard deviations of the three distributions?
View Related Questions